
The latest economic survey published by DairyNZ has some interesting points, especially the analysis of the five farm systems. Here we look at the difference between the Low (Systems 1&2) and the High (Systems 4&5) input systems:
Headlines
- The sample size of farms was 301, which is higher than the 217 the previous year, but still only represents 2.5% of the dairy farms in the country. More farms should join.
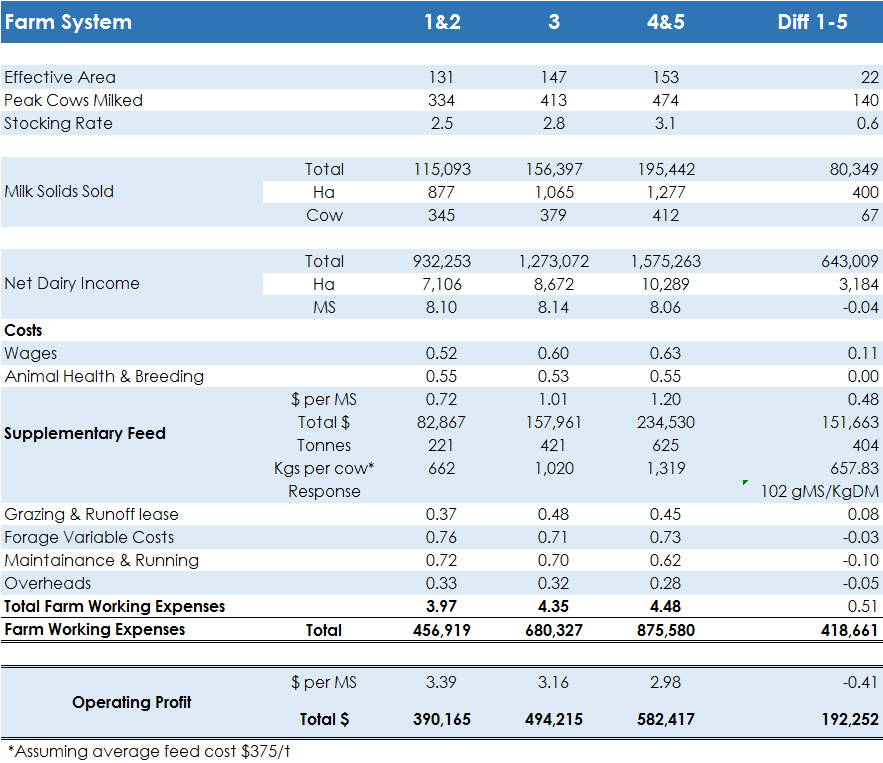
- The danger of there being too much emphasis on FWE per KgMS is highlighted as the High Input farms produced 400KgMS more per hectare resulting in an operating profit of $2,905 and $3,797 for Low and High input systems, whereas the FWE’s were $3.97 and $4.48 respectively.
- The Low input farms had Farm Working Expenses $2,239 lower per hectare than High Input farms, but produced $3,184 less income per hectare, resulting in High Input farms being $944 per hectare better off.
- Supplementary Feed costs for the Low Input system were $0.72/KgMS which, at a yield of 345KgMS, equates to $248.40 per cow. This is enough to pay for a delivered tonne of PKE per cow!
- High Input farms invested $197.76 per cow more in purchased feed than Low Input farms allowing for an increased stocking rate (2.5 v 3.1 cows per ha) and a huge 400KgMS increase in KgMS/ha (877 v 1,277).
- It is difficult to extract accurate figures for purchased feed use from the data, but assuming a purchased feed cost of $375/t, the Low Input system used 662Kg/cow and the High Input 1,319Kg/cow. Accounting for stocking rate, the High Input System bought in 2,136KgDM/ha. It would be good if actual figures were reported in the survey.
- Using the Dairy Club ‘Utilised Dry Matter per Hectare Calculator’ it has been calculated that potentially, the Low Input farms utilised 8,581KgDM/ha and the High Input farms 9,784KgDM/ha. So, even though the High Input farms imported 2,136KgDM/ha, they still utilised around 1,200KgDM/ha more. This is potentially due to the cropping options on the farm, as the High Input farms spent $265.69 more per hectare on forage variable costs.
- Using this data we can plot the two systems on the Milk Map© The blue dots represent farms analysed by Dairy Australia in their Grains2Milk Project. We can see that both of the dots are close to the bottom of the Milk Map©. The red High Input dot highlights that as an average some farms will be performing below the map, likewise some may be doing 200KgMS more for the same input! This shows that both systems could be far better at utilising forage and plugging gaps in management. The farms at the top of the Milk Map© are generally good at all aspects of management. The Red dot shows the High Input farms, which relative to the Low Input farms have produced 102gMS/Kg of supplement dry matter.
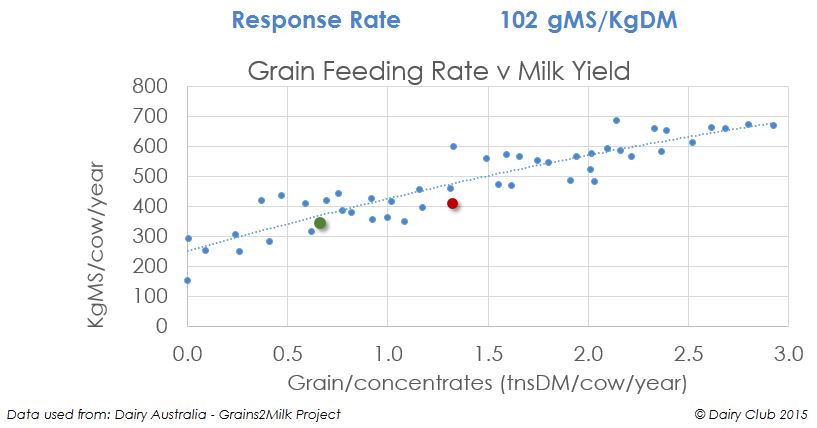
- These data show that both systems have lots of potential. The Milk yields for the Low and High systems are still only 71.8% and 85.8% of body weight assuming that the average cow weighs 480Kg. There is therefore lots of potential for more per cow production. Unfortunately the data supplied in the survey does not give us the number of days in milk.
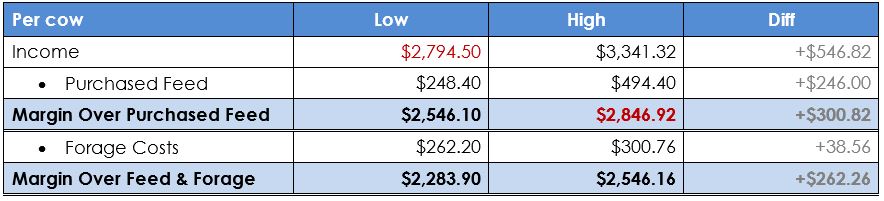
- Calculating Margin Over Purchased Feeds (MOPF) and Milk Over Feed and Forage (MOFF) gives some useful metrics. The table below sets out the data. It shows that the MOPF in the High Input farms is greater than the income for the Low Input farms (Figures in red to highlight).
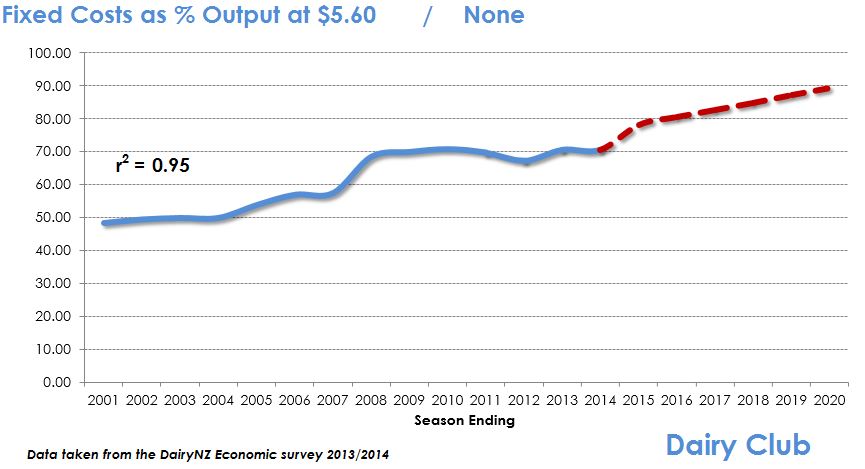
- Looking at the Fixed and Variable Costs using the Dairy Club – Routes to Profit forecasting tool, Fixed Costs are now $1,600/cow and Variable Costs $950/cow. This gives a combined total of $2,550 per cow. This means at a $5.60 payout the average cow needs to achieve over 455kgMS.
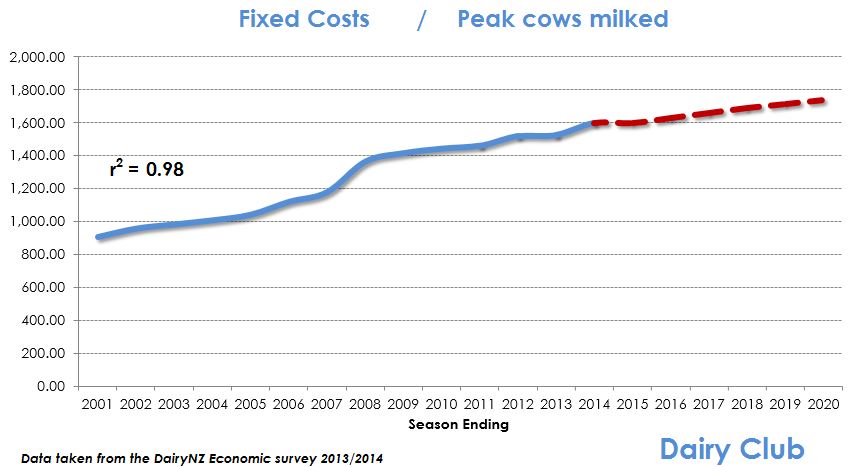
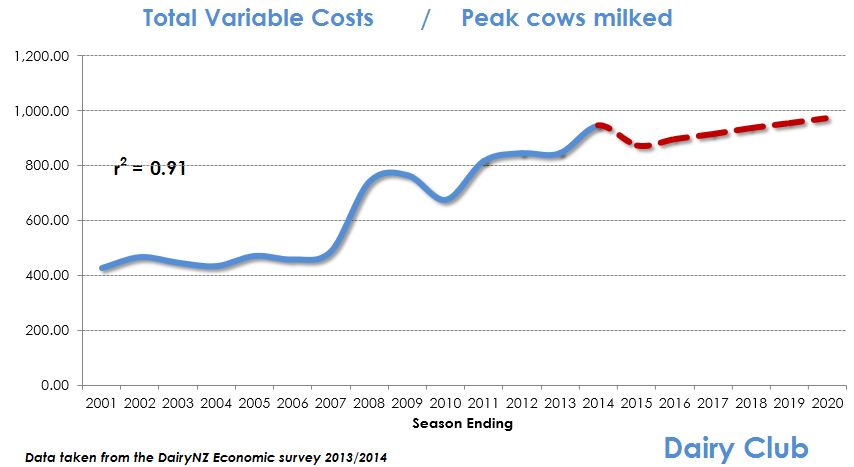
- By 2020 Fixed Costs are forecast to be $1,738 per cow and Variable Costs $973 giving a total of $2,711 per cow. At a $5.60 payout this equates to 484KgMS per cow. We therefore need to achieve substantially better productivity gains than at present. Fixed Costs as a % of output is a key measure and the most sustainable farms are the ones where Fixed Costs account for no more than 50% of the output at a $5.60 payout.
If you would like a Dairy Club consultant to review what this means on your farm please contact us here